Our longest-running platform

Know what your people should be paid

Salary decisions usually get made with a stale spreadsheet and a recruiter’s hunch. This replaces both: current market data, your own grades mapped onto it, and the budget consequence of every option before you commit to it.

Fresh market data, refreshed quarterly
Your grades, not generic job titles
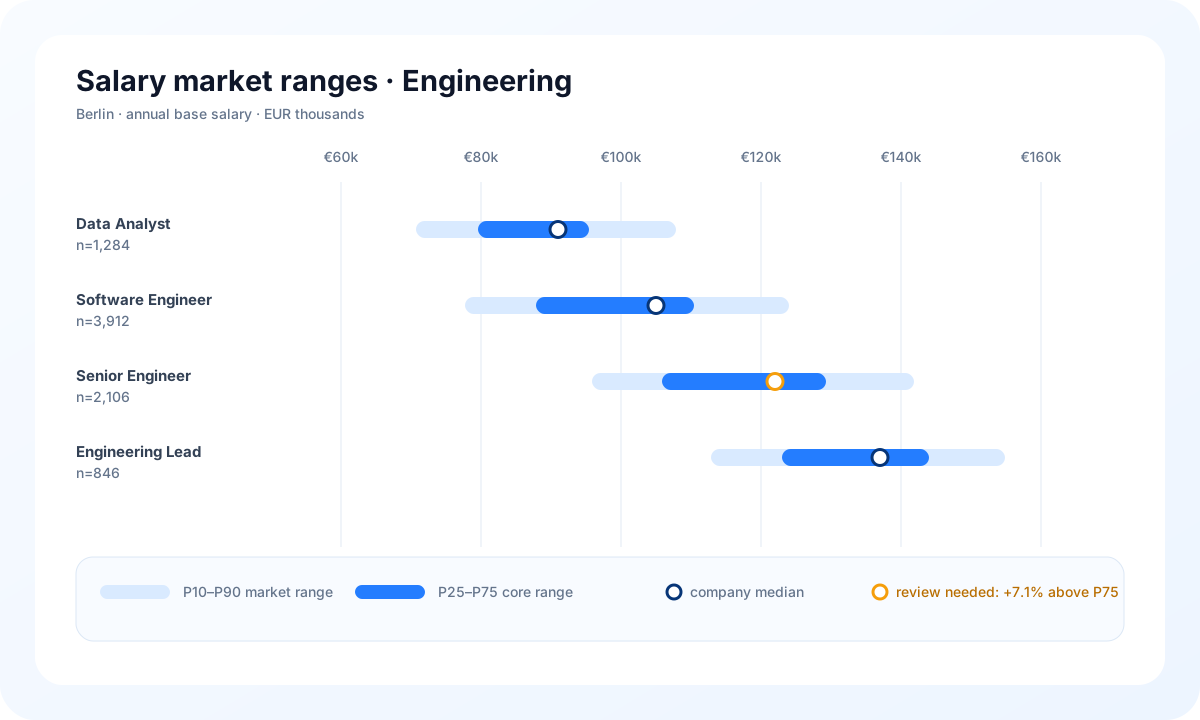
Salary market ranges and company medians for engineering roles in Berlin

What the platform actually does

Six pieces of work that used to take a week of spreadsheet archaeology each.

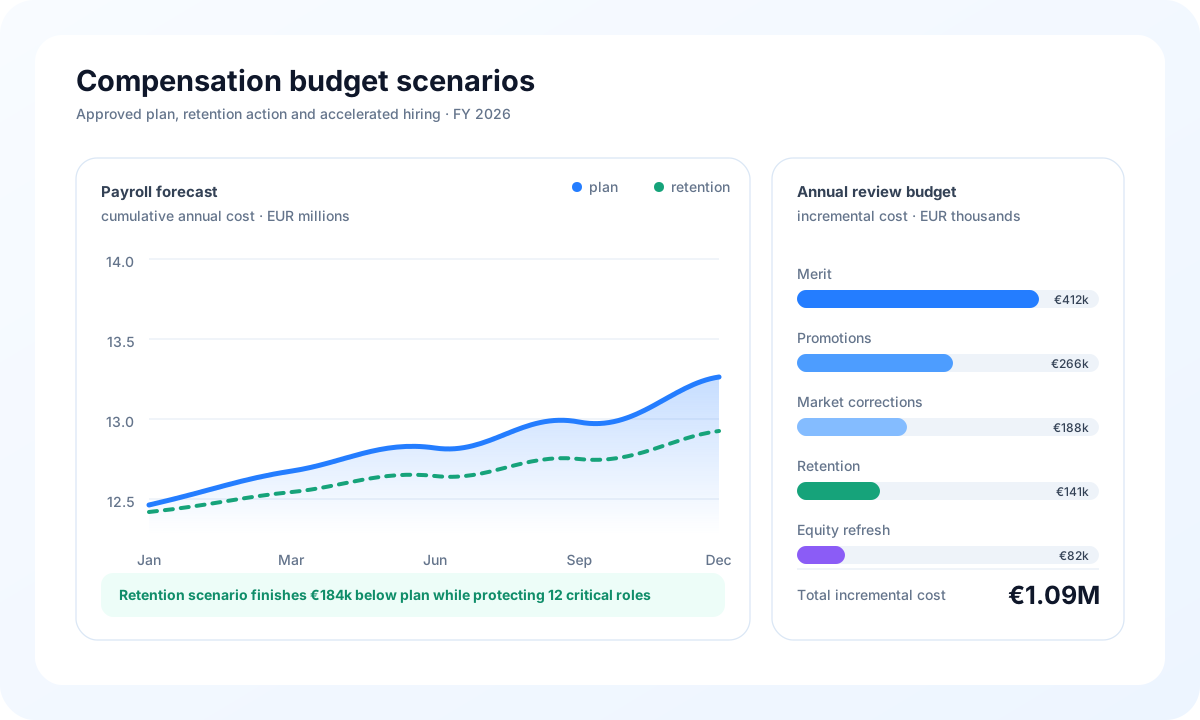
Payroll forecast and annual compensation review budget scenarios

Data Precision & Quality

Sources get cleaned, outliers get questioned, and job titles get matched to real roles rather than to whatever the posting called them.

Market Benchmarking

Compare by role, city, industry and seniority, with percentiles rather than a single misleading average.

Total Compensation Design

Build the whole offer in one place: base, bonus, equity and benefits, with the real cost to the company attached.

Budget Planning

Model the raise round before you announce it, with inflation, planned hires and the variance you are already carrying.

Forecasts and Alerts

Where rates are heading in your roles, and which people have drifted far enough below band to become a resignation.

Integrations

Connects to your HRIS, ERP, accounting and BI stack, with single sign-on and an API that covers everything the interface can do.

Three ways in

Most teams start with benchmarks and add planning once the first review cycle proves the point.

Comp&Ben Analytics

Benchmarks and market data

Current market rates for your roles and cities, with your grades mapped onto them and everything exportable.

  • Data cleaned and validated before it reaches you
  • Role and grade mapping for your structure
  • API access and BI integration
Most Popular
Strategic HR Suite

Planning and budgets

Complete workforce financial modeling with scenario planning, inflation tracking, and strategic budget controls.

  • Headcount growth modelling
  • Multi-currency with inflation applied
  • Export straight into your financial model
AI Intelligence Platform

Forecasting

Machine learning-powered market forecasts, retention risk analysis, and strategic compensation recommendations.

  • Outlier detection and retention risk flags
  • Suggested bands and grades to review
  • Dashboards you can take to the board

One screen before the meeting

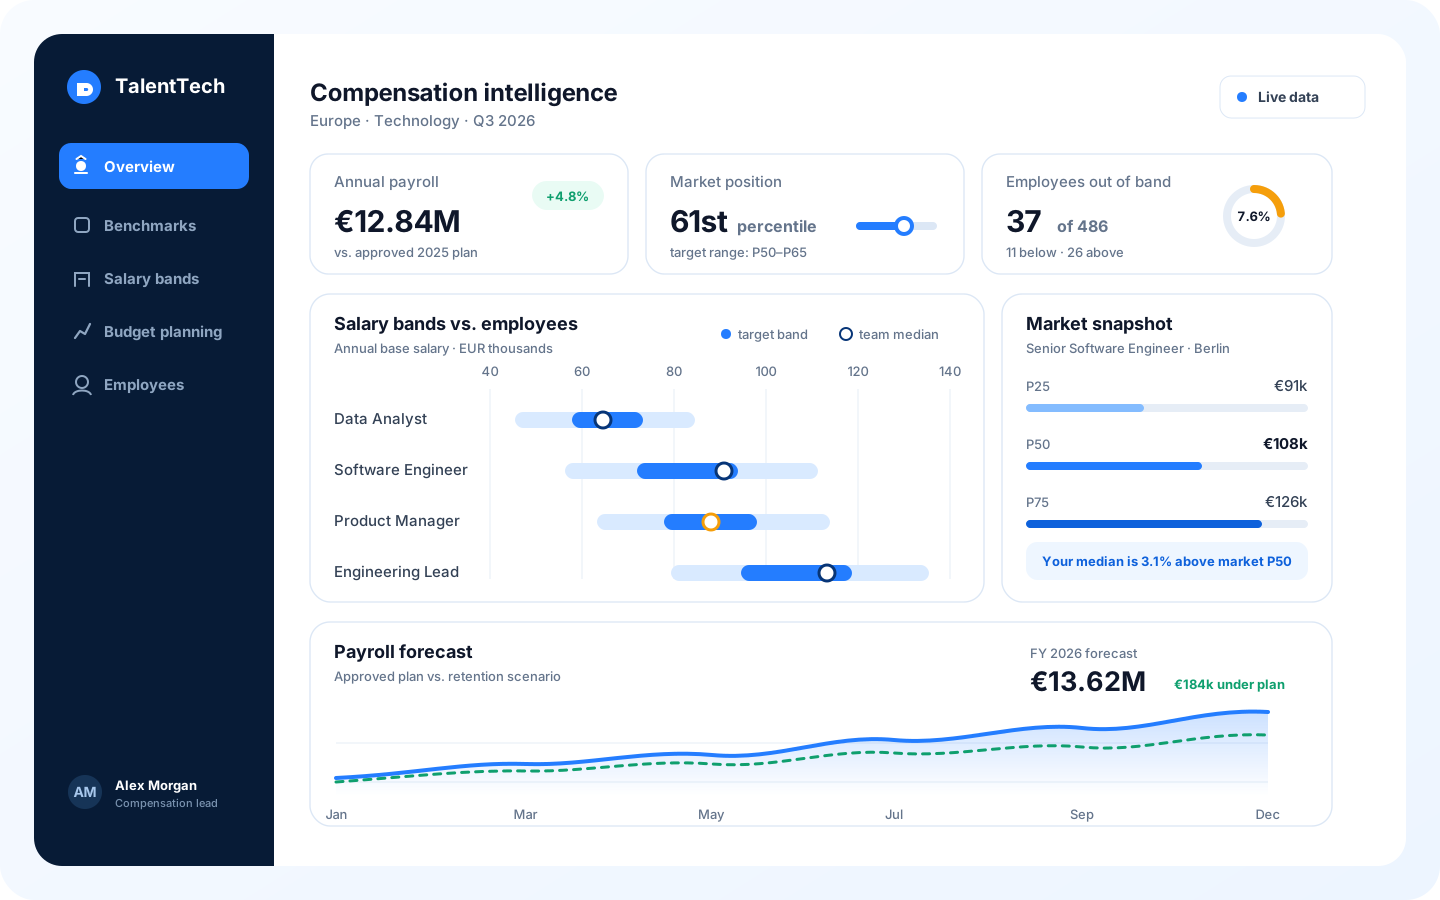
Before a comp review you need three answers: where your bands sit against the market, which roles have drifted, and what the year costs if you fix them. The overview puts all three in one place, so you walk into the room with a position instead of a spreadsheet.

Compensation overview Engineering, Berlin, FY26
Compensation overview showing salary bands by grade, position against the market and the annual payroll forecast
Bands and outliers together

Every grade with its range, and the people sitting outside it, on the same axis.

Market position, not a guess

Your medians against fresh market data for the same roles and the same city.

Cost of the decision

What closing the gap does to payroll this year, before you promise anything.

The four views teams open most

Each one answers a question that comes up in every review cycle. Figures below use sample data, not client numbers.

Salary bands by grade

Interquartile range, EUR gross per year. Labels show the median.

Data table
GradeP25 MedianP75
L132 00038 00044 000
L242 00050 00058 000
L356 00066 00078 000
L474 00088 000104 000
L596 000114 000136 000
L6124 000148 000178 000

Your pay vs market median

Median total cash by role, EUR gross per year.

Data table
RoleMarket Your company
Backend78 00081 000
Frontend71 00068 000
Data84 00079 000
DevOps86 00092 000
QA58 00057 000

Payroll budget scenarios

Projected annual payroll, EUR millions, by quarter.

Data table
QuarterBaseline Market catch-up
Q14.204.20
Q24.324.48
Q34.414.71
Q44.554.98

Total compensation mix

Share of total package by level, per cent.

Data table
LevelBase BonusEquity Benefits
Junior84628
Mid76978
Senior6612157
Staff5614237

"TalentTech brought transparency to our compensation strategy, reduced budget overspend by 12%, and delivered evidence-based decisions for our salary adjustments."

VP of People, High-Growth Tech Company
Trusted By
100+ Companies
300K+ Positions
95% Accuracy

Enterprise Pricing for HR Analytics

Full plan detail, billing and refund terms are on the pricing page.

Flexible SaaS subscription model. Seat and project limits grow with you.

Monthly Annually −20%
Most Popular
Analytics Starter
600/yr
  • Essential market reports and benchmarks
  • Role and regional analysis
  • Export capabilities and dashboards
Get Started
Growth Professional
8000/yr
  • AI insights and predictive forecasting
  • MCP integration and advanced analytics
  • Enhanced security and custom AI models
Choose Plan
Enterprise Comp&Ben
Custom
  • Dedicated SLA and premium support
  • Enterprise integrations and SSO
  • Private cloud deployment
Contact Sales

Want to see it on your own numbers?

Send us a role list and we will run it against current market data before the call, so the walkthrough uses your figures instead of a demo account.

Schedule Your Demo

Tell us which roles matter most and we will bring benchmarks for them to the first conversation.

Phone
+374/44/150533
Global Presence
Armenia, remote worldwide